Mastering the Basics: 7 Common Trading Indicators Every Learner Should Know
What Are Common Trading Indicators and Why Do They Matter?
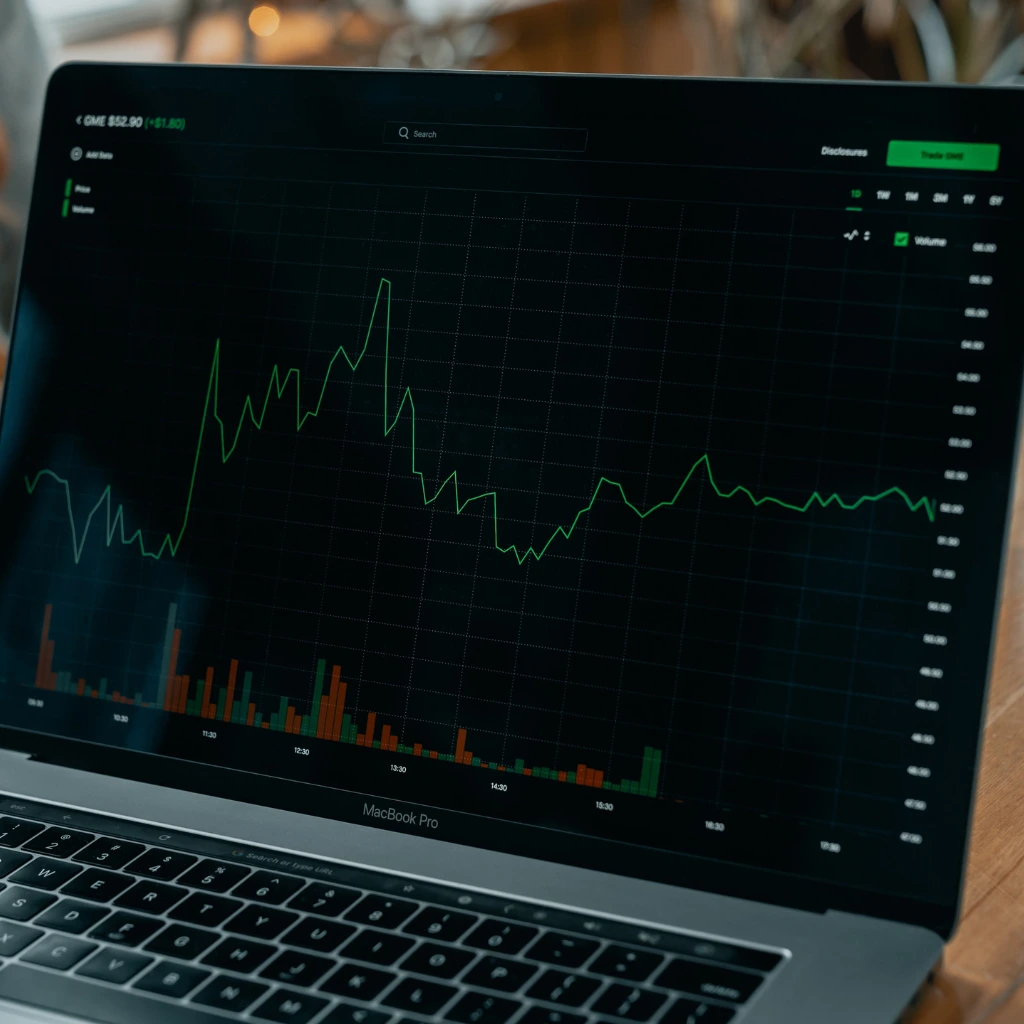
If you’re starting your journey into trading, you’re bound to come across a wide range of charting tools and technical lingo. Among them, common trading indicators are some of the most widely used tools for making sense of price action. They’re not just fancy graphs—they’re based on math, behavior, and probability.
These indicators help traders analyze trends, identify entry or exit points, and manage risk. In this article, we’ll walk through seven essential trading indicators that you’ll find in almost every trading platform, along with a plain-English explanation of what they do.
1. Relative Strength Index (RSI) – One of the Most Common Trading Indicators for Reversal Signals
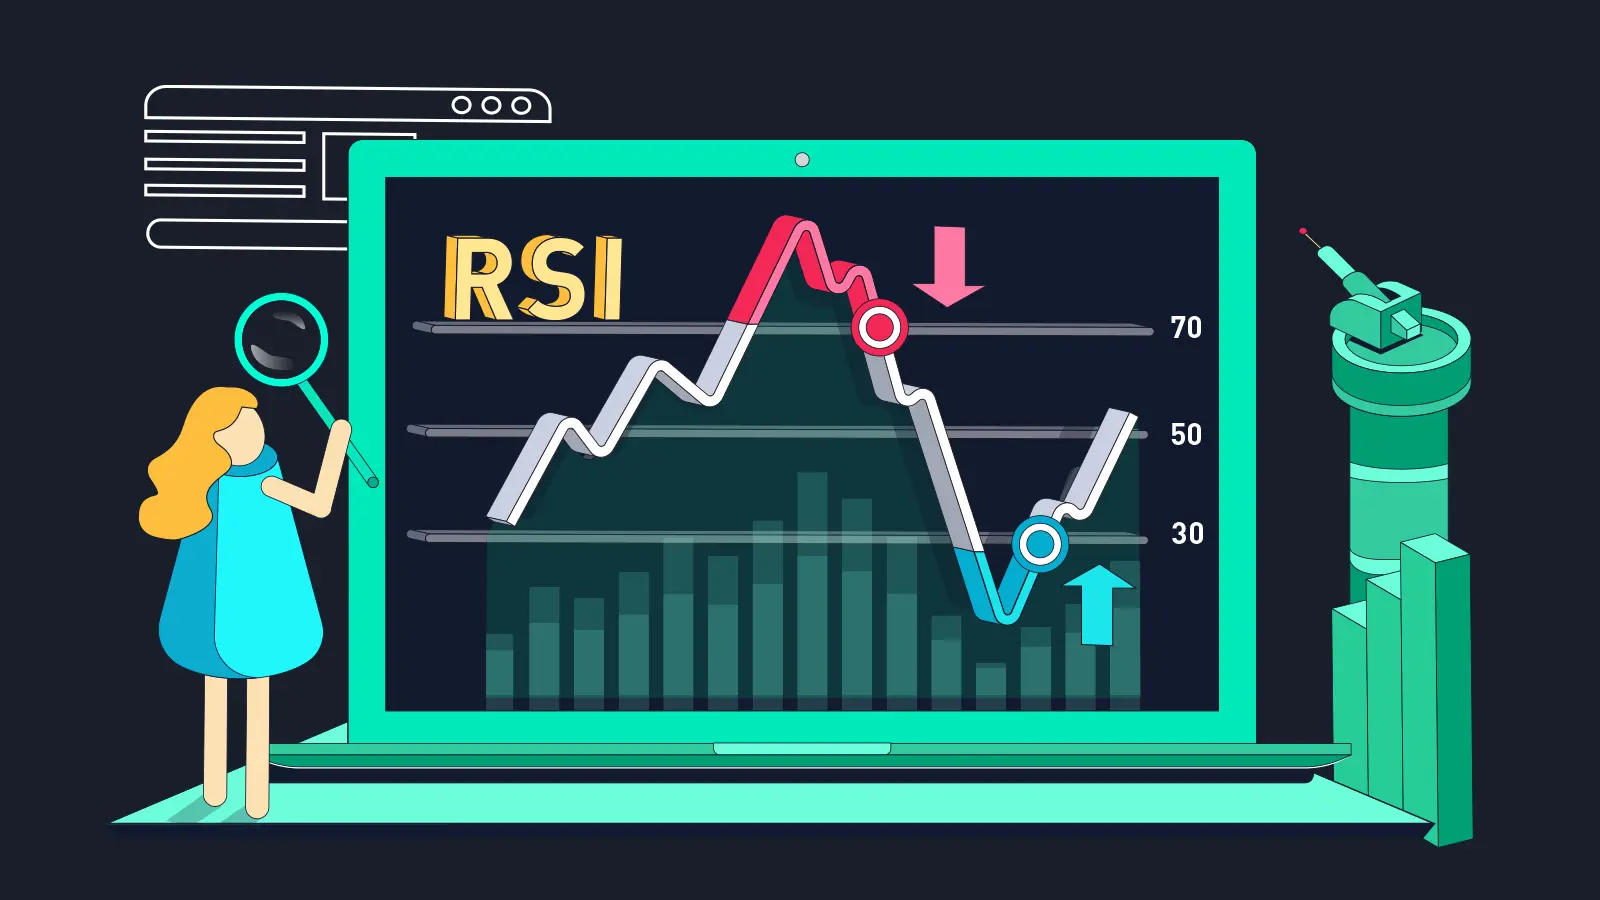
RSI is one of the most common trading indicators for identifying when a stock or asset might be overextended. It ranges from 0 to 100. Typically, values above 70 are considered “overbought” and below 30 are “oversold.”
Why it matters:
Traders use RSI to look for potential reversals or pullbacks. However, RSI isn’t a guarantee—assets can stay overbought or oversold for longer than expected, especially in strong trends.
2. Moving Averages – Common Trading Indicators That Simplify Trends
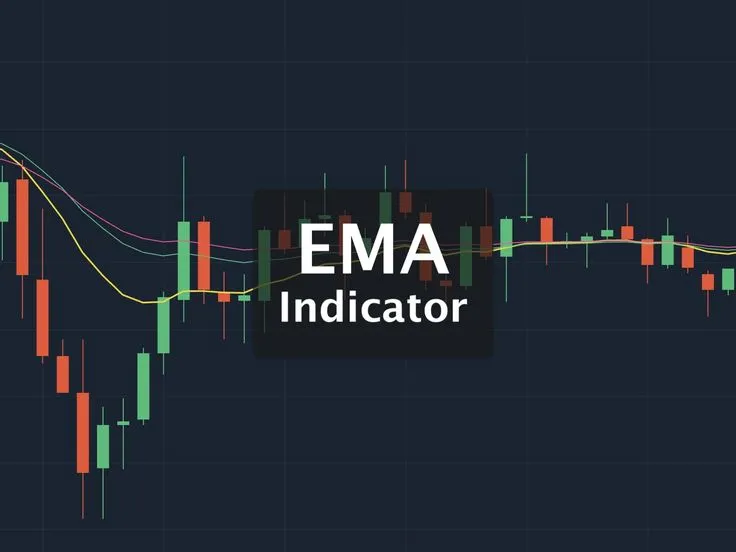
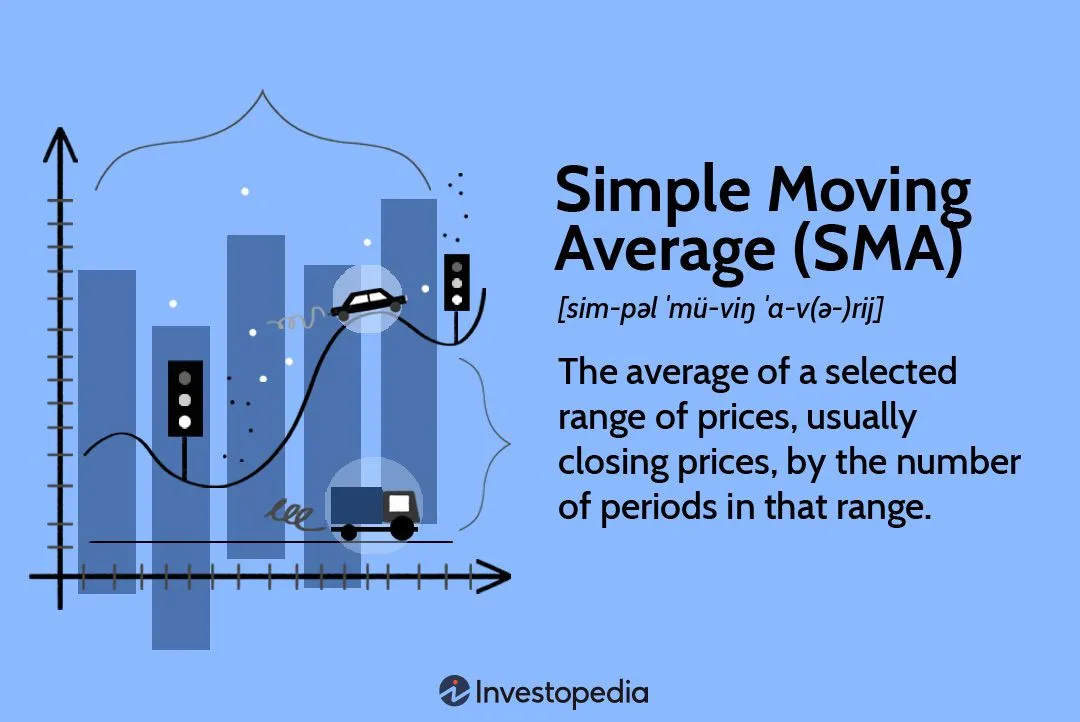
Moving Averages (MA) help simplify the chaos of price fluctuations. The two main types are Simple Moving Average (SMA) and Exponential Moving Average (EMA). SMA gives equal weight to all prices over a period; EMA gives more weight to recent prices.
How traders use it:
Many look for crossovers (like when a short-term EMA crosses a long-term one) as a signal of a new trend. MA is considered a lagging indicator, meaning it follows price movements rather than predicting them.
3. MACD – Momentum Meets Trend Analysis
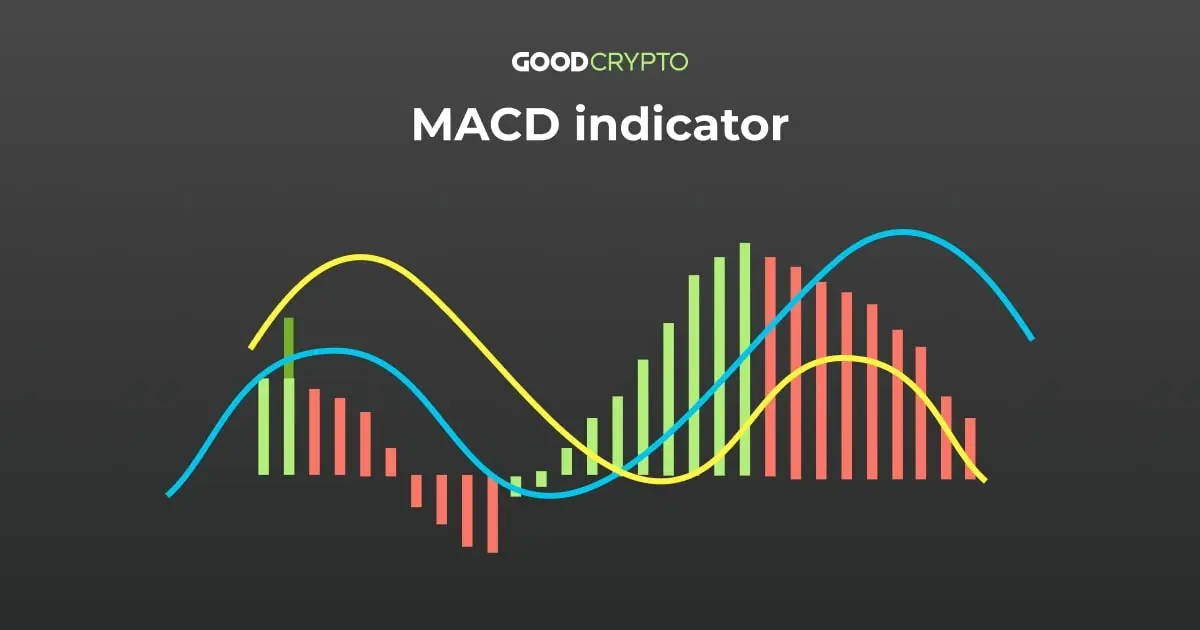
MACD stands for Moving Average Convergence Divergence. It uses two EMAs (often 12 and 26-period) to create a MACD line and a signal line. A histogram shows the difference between them.
What it tells you:
When the MACD line crosses the signal line from below, it can suggest bullish momentum. Crosses from above may hint at bearish momentum. Still, it’s most effective when used in combination with other indicators.
4. Bollinger Bands – Visualizing Market Volatility
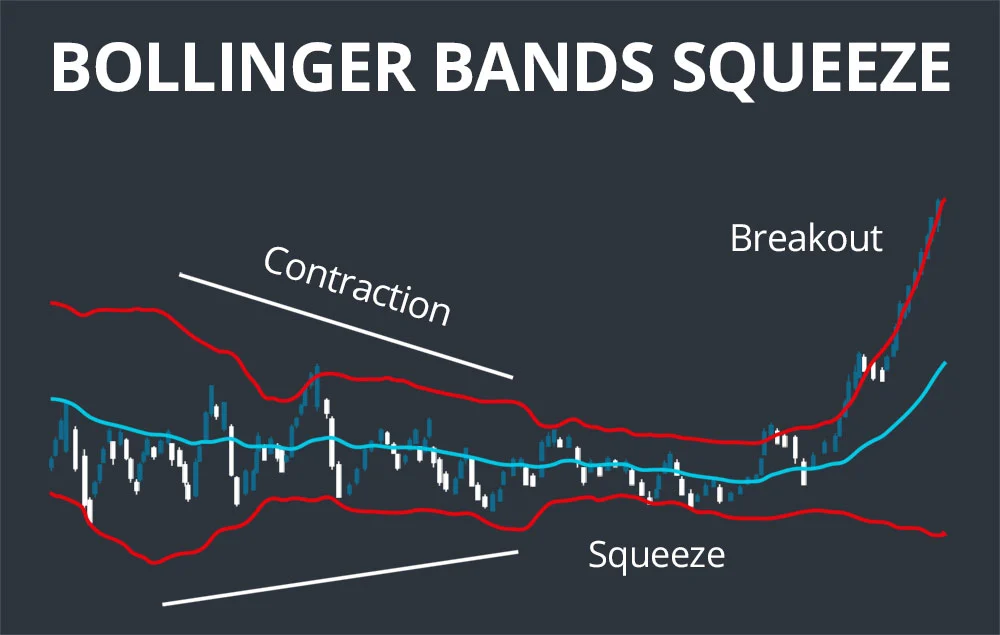
Bollinger Bands consist of a middle SMA line and two standard deviation lines above and below. They expand and contract based on market volatility.
Educational insight:
When the bands are narrow, it often means the market is quiet—and a breakout might be coming. When the price touches the outer band, it doesn’t necessarily mean a reversal. It’s more of a cue to watch for confirmation.
5. Stochastic Oscillator – Comparing Price Position to Historical Ranges
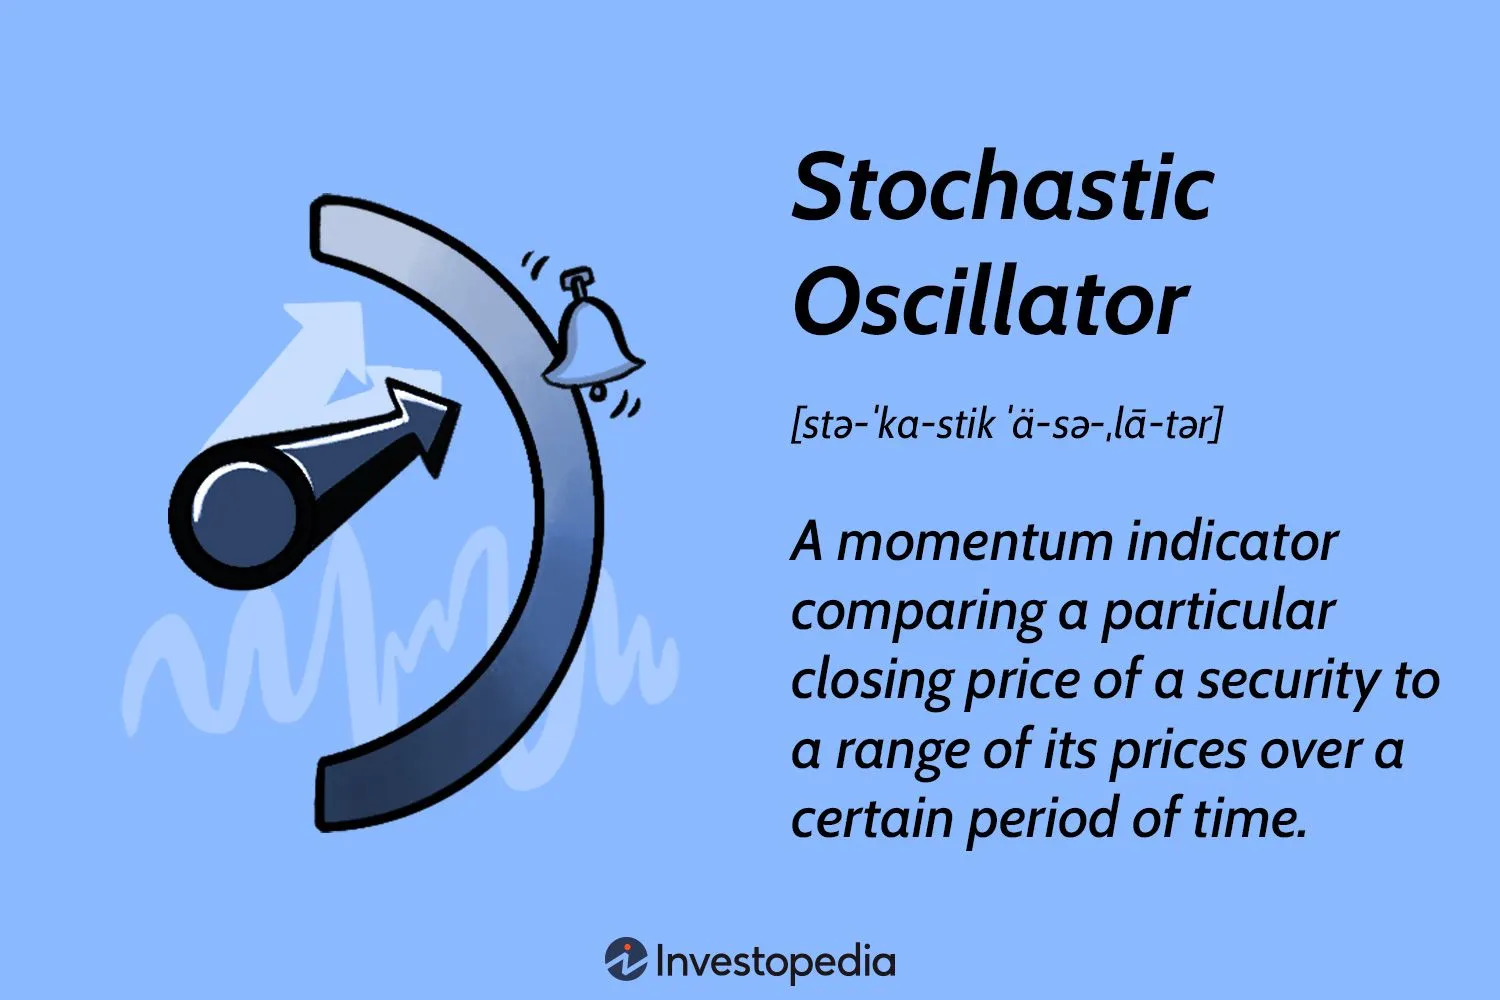
This oscillator compares the current closing price to its price range over a given time frame, often using a %K and %D line.
Why it’s useful:
It helps identify overbought and oversold conditions, similar to RSI. Crosses between the %K and %D lines can signal potential trend shifts—but it’s best on slower timeframes.
6. Volume – Confirmation Is Key
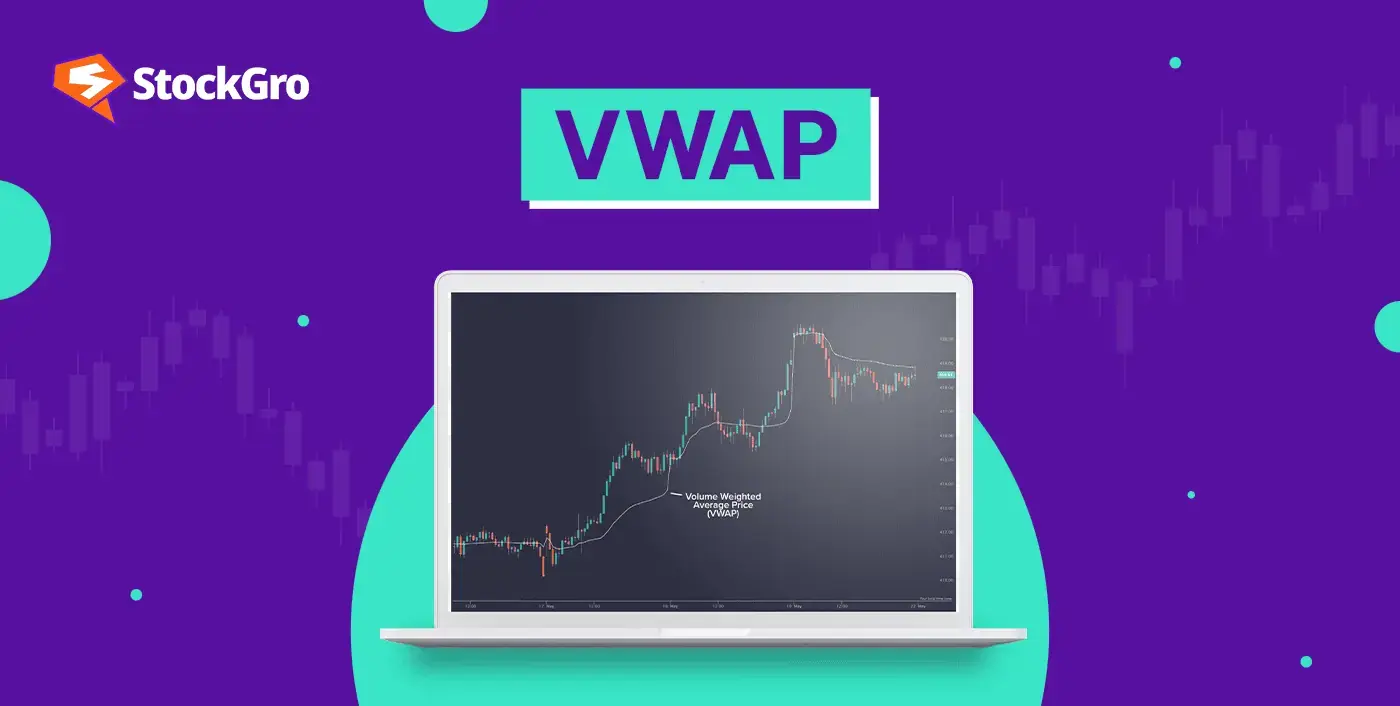
Volume measures how much of an asset is traded in a given time frame. Although it isn’t a line-based indicator like others, it plays a vital supporting role.
Real-world use:
High volume often confirms the strength of a price move. For example, if a breakout happens with low volume, it may be less reliable. Volume indicators like VWAP (Volume Weighted Average Price) give extra context.
7. Fibonacci Retracement – A Predictive Support and Resistance Tool
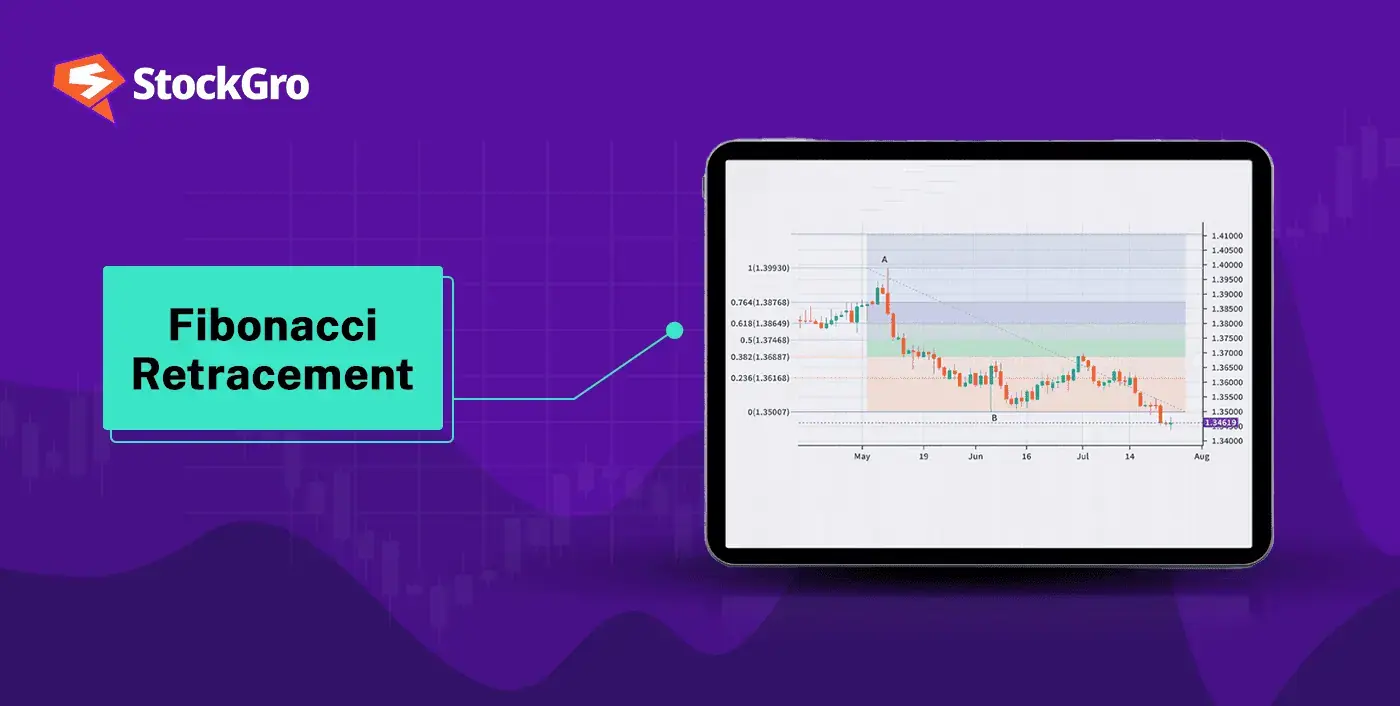
This tool uses mathematical ratios (like 38.2%, 50%, and 61.8%) based on the Fibonacci sequence to highlight areas where prices may pause or reverse.
How traders use it:
Drawn between a significant high and low, the retracement lines act as potential support/resistance. While not always exact, many traders trust them due to widespread market belief and psychological impact.
Conclusion: Using Common Trading Indicators Wisely

There’s no single best trading indicator. Each of these common trading indicators serves a unique purpose—and they shine brightest when used together. Think of them like instruments in a band: one by itself sounds fine, but together they create something stronger.
As you grow as a trader, you’ll develop a feel for which indicators align with your strategy. Start simple, test what works for you, and always prioritize learning over guessing.
Trading isn’t about being perfect—it’s about being prepared.
Relevent news: Here


